Method Scope
Dive deep into the heart of your Unity projects with Method Scope, a central feature of the Method Studio. Designed to empower developers with precise control and comprehensive insights, Method Scope enhances your debugging toolkit by allowing detailed method execution, parameter manipulation, and direct result analysis.
Overview
Interface Highlights
Method Scope boasts a sleek, user-friendly interface that includes:
-
Header: Showcases the method name and return type icon, equipped with a close button and an information button that reveals detailed method properties in a popup.
-
Signature Display: The method signature, adorned with syntax highlighting, provides a clear and immediate understanding of method parameters and structure.
Core Functionalities
The functionalities within Method Scope are organized into three dynamic tabs:
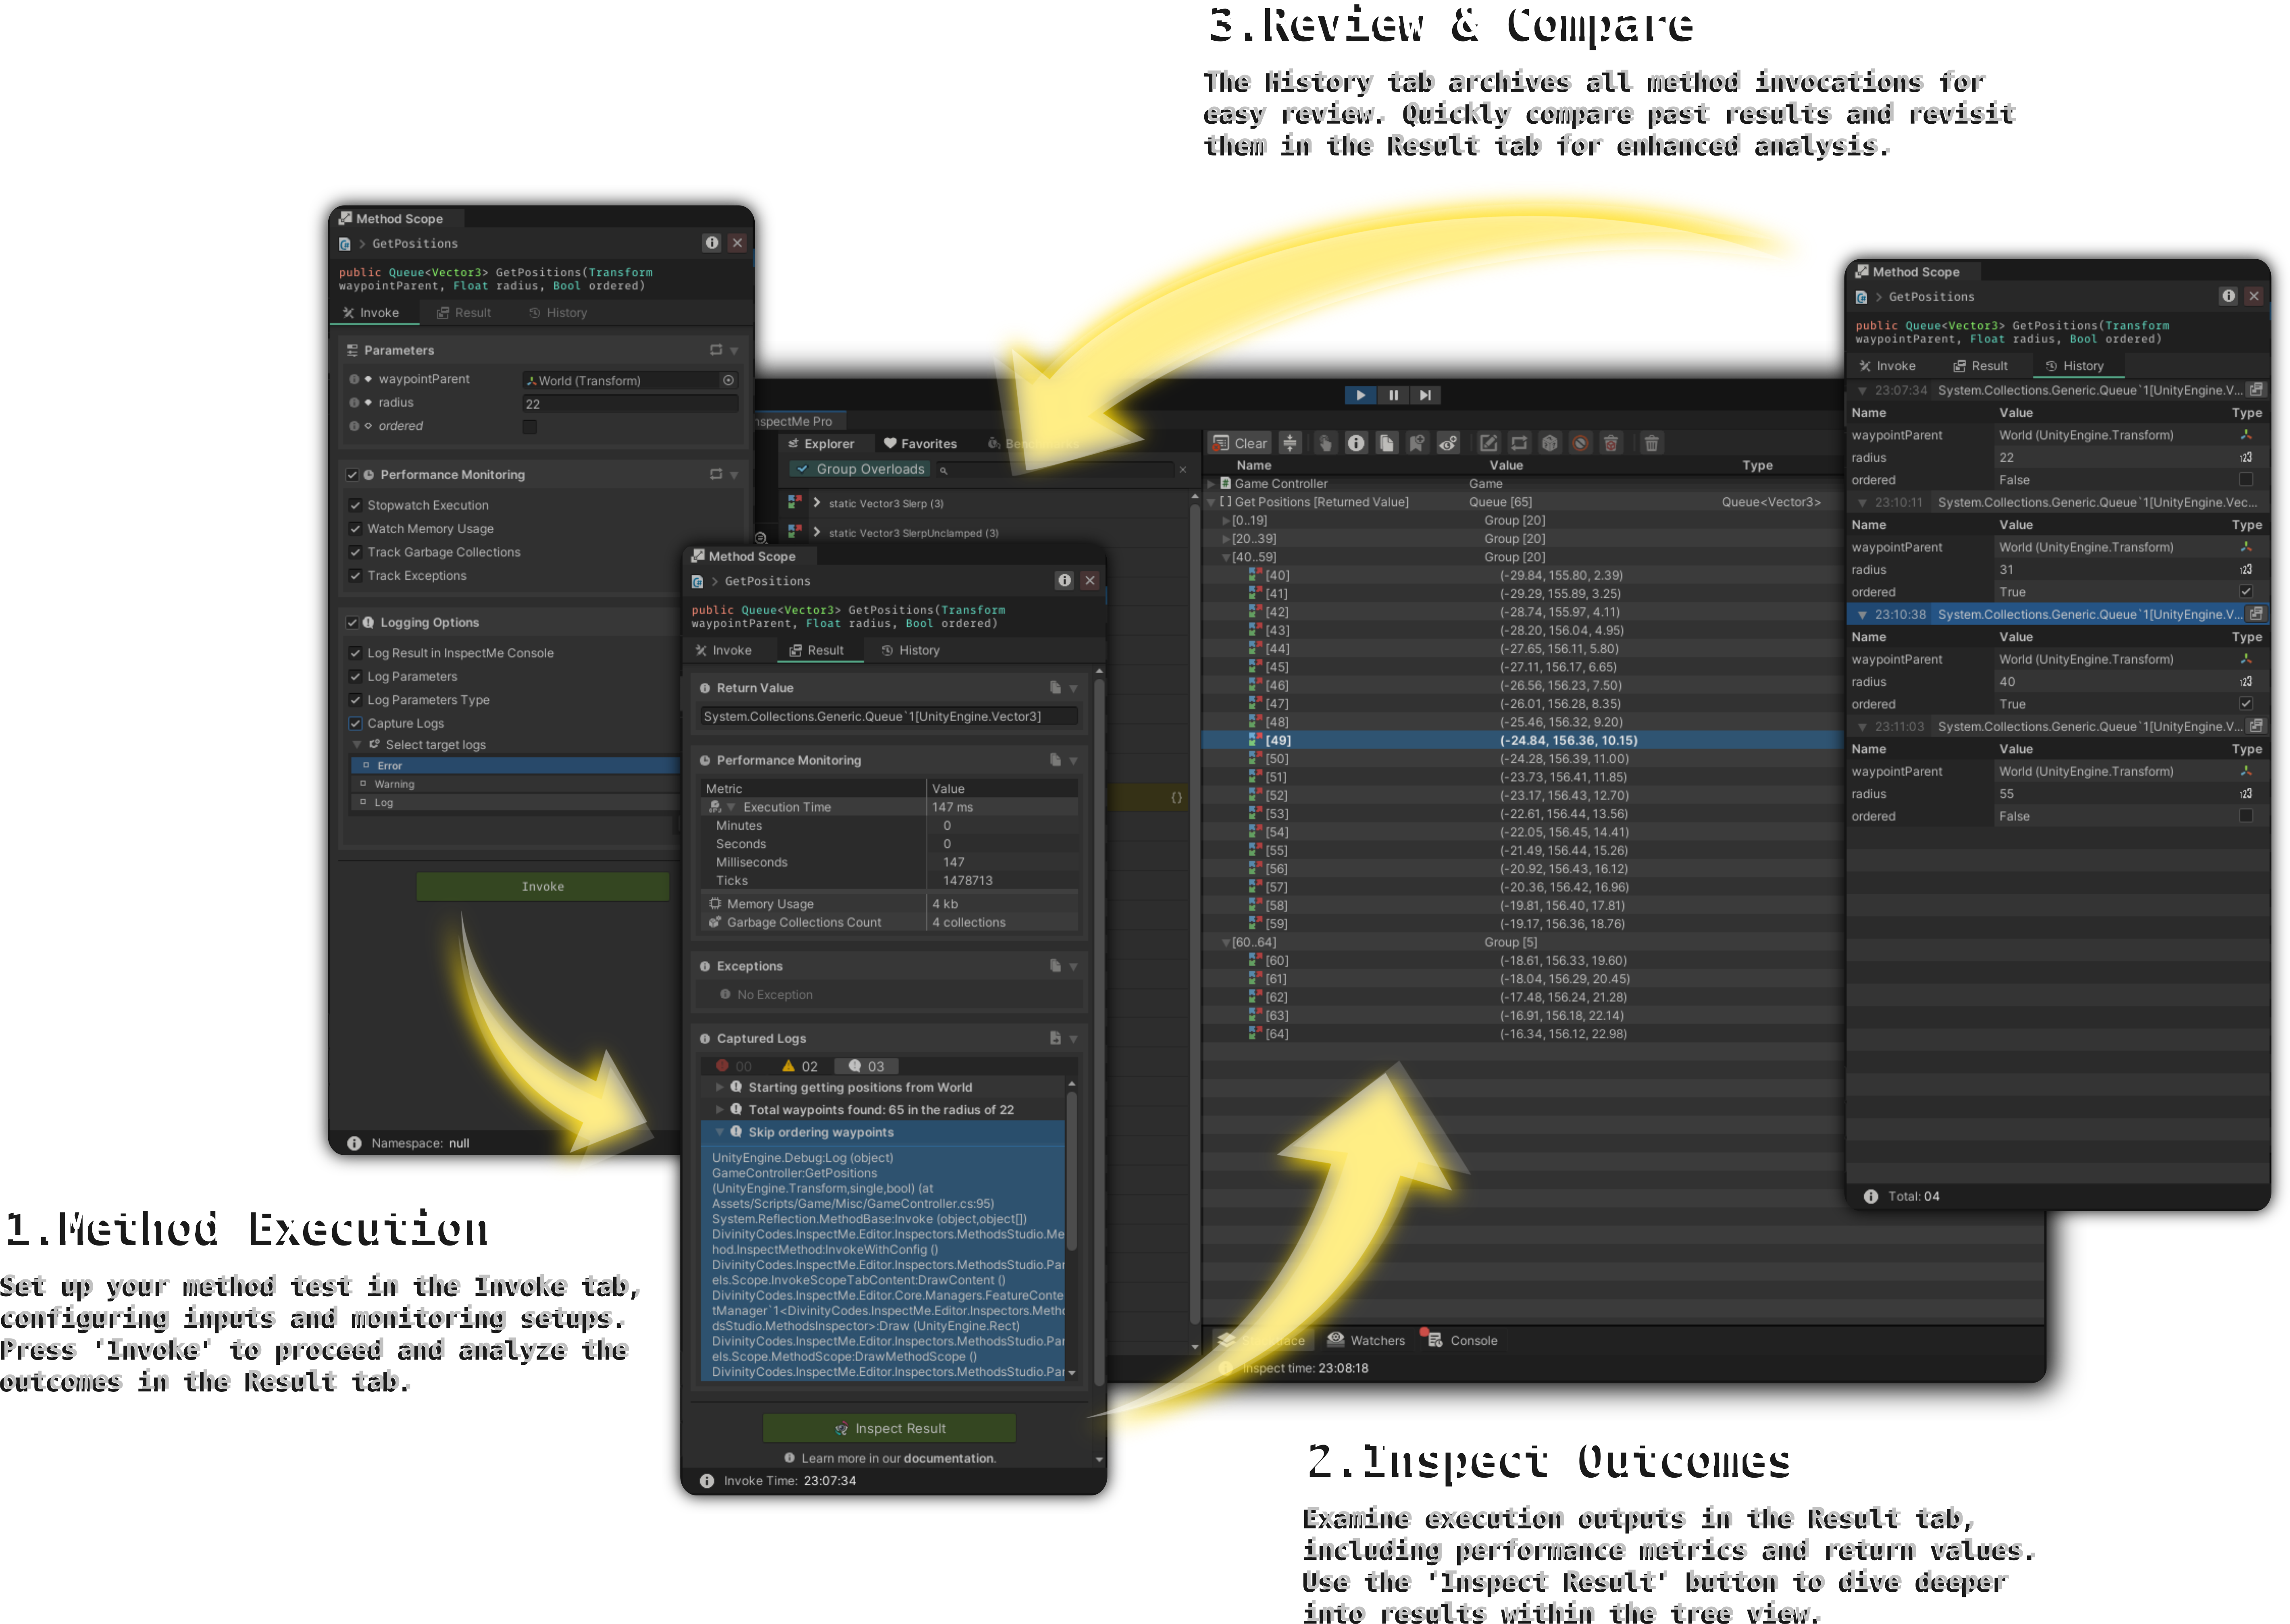
Prepare and execute methods with precision:
-
Parameters Group: Adjust method parameters dynamically to test various input scenarios.
-
Performance Monitoring Tools:
- Stopwatch: Measure execution time down to the millisecond.
- Memory Tracker: Monitor memory usage and manage resources effectively.
- Garbage Collection Detector: Keep tabs on garbage collection events to optimize performance.
- Exception Tracker: Automatically capture and log exceptions for hassle-free debugging.
-
Logging Configuration:
- Log Result: Record execution results directly in the InspectMe console.
- Capture Logs: Customize log settings to filter specific log types, enhancing your debugging context.
-
Invoke Button: Executes the method with all configured settings, capturing detailed data for analysis.
After method execution, delve into the results:
-
Return Value Display: For methods that return values, see the outputs formatted and ready for review.
-
Performance Results Table: Detailed metrics such as execution times and memory usage are laid out for thorough analysis.
-
Inspect Button: A highlight of InspectMe, this button lets you explore complex return types within the tree view, providing an interactive, real-time inspection of the output structure. This powerful tool brings the abstract into the tangible, allowing you to navigate and understand the intricacies of method outputs like never before. Learn More
-
Exception Details: Detailed information on exceptions provides insights into potential issues and helps streamline the resolution process.
Chronicle your method testing journey:
- Invocation Archive: Records each method call, including parameters, results, and logs, allowing for a comprehensive review of past performances.
- Result Comparison: Utilize historical data to compare how modifications affect method behavior over multiple tests.
Utilizing Method Scope
Conclusion
Method Scope within Method Studio marks a significant advancement in how developers approach debugging in Unity. By integrating detailed execution control with direct output inspection, InspectMe not only simplifies but also deepens the debugging process, paving the way for refined and efficient code optimization.
For any queries or support regarding Method Studio feature, please refer to our Support section or visit our FAQ page.